What power quality events are in practice
Industrial systems expect voltage to follow a stable sinusoidal pattern within defined limits. When that pattern shifts, equipment reacts immediately. Controllers reset, drives enter fault states, and protective relays intervene. These reactions are not random. They align with specific categories of power quality events that have distinct electrical signatures and operational consequences.
Power quality events – deviations in voltage behavior that exceed acceptable operating limits, often for short durations, but with outsized operational impact across control systems, drives, and protection equipment.
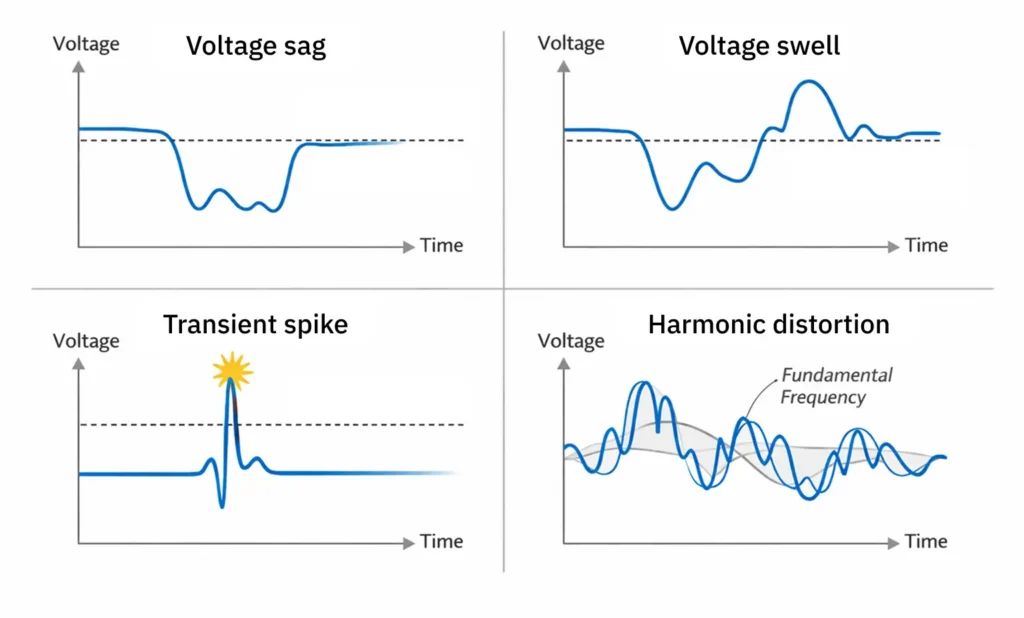
These events are distinguished by how voltage changes over time and frequency. Some involve amplitude drops or rises. Others distort waveform shape or introduce high-speed impulses. Each type interacts differently with industrial loads, which explains why the same electrical issue may crash one system while another appears unaffected.
Voltage sags and their operational footprint
Voltage sags are among the most frequent power quality events in industrial settings. They occur when RMS voltage drops for a short duration, often due to faults, large motor starts, or sudden load changes upstream. From an electrical perspective, the drop may seem modest. From a control perspective, it can be decisive.
PLCs, drives, and contactors rely on minimum voltage thresholds. When voltage dips below those thresholds, even briefly, logic resets and safety states trigger. Operators experience this as unexplained stops rather than clear electrical faults. Over time, repeated sags increase nuisance downtime and erode confidence in process stability.
The challenge is not only detecting sags, but understanding their patterns. Research shows that sag duration, depth, and phase location matter. Two sags with similar magnitude can have very different effects depending on timing within the waveform. Without waveform-level visibility, these distinctions disappear, leaving teams with incomplete explanations.
Voltage swells and hidden stress
Voltage swells attract less attention than sags, yet their long-term impact can be more damaging. Swells occur when voltage rises above nominal levels, often following sudden load disconnections or regulation issues. Unlike sags, swells may not cause immediate trips. Equipment keeps running while insulation and power electronics absorb additional stress.
Over time, this stress accumulates. Transformers run hotter. Capacitors age faster. Power supplies operate closer to their limits. The absence of immediate failure often delays investigation, which allows damage mechanisms to continue unnoticed.
Research highlights that swells tend to be less frequent but longer in duration than many sags. That combination makes them especially relevant for reliability analysis. When swells remain invisible, maintenance teams lose the chance to correlate early degradation with electrical conditions.
Transients as fast and destructive events
Transients operate on a different timescale. These are fast voltage spikes that rise and fall within microseconds or milliseconds. They often originate from switching actions, capacitor banks, or external events such as lightning. Because of their speed, transients can bypass conventional RMS monitoring entirely.
For semiconductors and control electronics, transients pose a direct threat. High peak voltage can punch through insulation layers or corrupt logic signals. Even when damage is not immediate, repeated exposure degrades components in ways that appear later as intermittent faults.
Research emphasizes that transient detection requires high sampling rates and careful signal processing. Without this capability, systems appear stable while hidden electrical stress accumulates. That gap explains why some failures seem random until waveform data is reviewed.
Harmonics and waveform distortion over time
Power quality issues translate directly into operational cost, even when they do not trigger obvious alarms. Downtime, reduced equipment life, and energy losses accumulate quietly. When electrical visibility is missing, these costs appear disconnected from their root cause.
In industrial environments, the impact extends beyond maintenance. Production schedules slip. Energy performance targets drift. Reliability metrics degrade without a clear explanation. Research consistently links repeated exposure to power quality events with accelerated aging and increased failure rates.
Downtime, reliability, and aging effects
A single voltage sag may cause a brief stop. Repeated sags across weeks or months change maintenance patterns. Components that should last years fail early. Teams respond reactively, replacing parts without addressing the electrical conditions that drive failures.
The same pattern applies to harmonics and swells. Their impact is incremental. Without trend analysis, operators see isolated failures rather than a system-wide stress profile. Research highlights that power quality data becomes most valuable when it is correlated over time, not treated as isolated events.
Power quality as a predictive signal
Power quality measurements offer early indicators of stress that traditional condition monitoring misses. Event frequency, severity, and timing reveal how assets interact with the electrical environment. When these signals are ignored, teams rely on mechanical symptoms alone, which often appear too late.
Event frequency trends – repeated power quality disturbances at specific locations often precede equipment degradation, offering a measurable early signal for reliability planning.
By trending power quality events alongside operational data, organizations reduce guesswork. Maintenance planning shifts from reactive replacement to targeted intervention. The absence of this visibility forces teams to wait for failures before acting.
How power quality events are detected and classified
Detecting power quality events requires more than basic voltage logging. Research shows that resolution, timing, and processing methods determine whether events are visible or missed entirely. Many systems collect electrical data but lack the structure to turn it into actionable insight.
Measurement and data acquisition constraints
High-speed events demand high sampling rates. Transients and waveform distortions disappear when sampling is too slow. Sensor placement also matters. Measurements taken far from the point of disturbance may dilute or mask events.
Noise, offsets, and harmonics complicate detection further. Research emphasizes preprocessing as a critical step. Without proper filtering and normalization, false positives increase and real events blend into background variation. This leads to alert fatigue or, worse, false confidence.
Signal processing and event extraction
Time-frequency analysis plays a central role in separating overlapping phenomena. Techniques such as wavelet transforms and adaptive filtering allow systems to capture non-stationary behavior that RMS metrics miss. These methods reveal when an event starts, how it evolves, and how severe it becomes.
The value lies not in the mathematics, but in the operational clarity they provide. When events are extracted consistently, teams stop debating whether an issue is electrical. They see clear signatures tied to specific mechanisms.
Machine learning for classification of power quality events
As data volumes grow, manual classification becomes impractical. Research shows that learning-based models handle noise and variability better than fixed thresholds. Convolutional and sequence-based models learn patterns directly from waveform data, reducing reliance on handcrafted rules.
This shift changes how root cause analysis works. Instead of sorting through logs after an incident, systems classify events as they occur. Engineers stop guessing which disturbance caused a failure and start working with labeled, time-aligned evidence.
Applying power quality analytics in industrial systems
Power quality data only delivers value when it integrates with existing operational systems. Isolated electrical dashboards add context, but they do not change decision-making unless linked to process data, alarms, and maintenance workflows.
Integration with SCADA and historians
SCADA systems already manage alarms and operational visibility. When power quality events flow into the same environment, operators gain immediate context. An unexplained stop becomes a voltage sag at a specific timestamp, correlated with upstream activity.
Historians extend this value over time. By storing event data alongside process variables, organizations identify patterns that would otherwise remain hidden. Troubleshooting becomes faster because the electrical cause is no longer detached from operational history.
Digital twins and contextual analysis
Digital twins add another layer by linking electrical behavior to asset models. Research shows that when real-time measurements align with simulated expectations, deviations become easier to interpret. A transient is no longer just a spike. It becomes an event interacting with a specific transformer, feeder, or drive.
This context changes decision-making. Engineers evaluate scenarios instead of reacting to alarms. Managers see how electrical conditions affect performance across the system, not just at isolated points.
Choosing the right analytical approach
Not all power quality monitoring approaches deliver the same value. Threshold-based systems offer simplicity but struggle with complex environments. Data-driven methods adapt, but require structure and governance.
Fixed thresholds work for clear-cut limits. They fail when events overlap or evolve. Research demonstrates that compound disturbances often bypass static rules, creating blind spots. Learning-based systems adapt to site-specific conditions, reducing false alarms and missed events.
The tradeoff lies in implementation effort. Learning models require quality data and validation. When done properly, they reduce uncertainty. When skipped, teams revert to manual interpretation and delayed response.
Power quality analytics in CENTO
Industrial platforms increasingly unify electrical and operational data. Within a CENTO-style digital twin architecture, power quality analytics align naturally with real-time data pipelines and asset models.
Waveform-level events feed into a structured data layer. Classification and context link events to assets, processes, and historical trends. Operators stop switching tools. Engineers stop reconciling timestamps manually. Managers stop waiting for reports to understand why performance shifted.
How organizations typically start
Most organizations begin with visibility. They instrument critical points and capture events. The next step is correlation, linking electrical data to operational outcomes. Over time, analytics and modeling deepen understanding, enabling proactive decisions.
The absence of this progression leaves power quality data underused. Files accumulate. Incidents repeat. With structured integration, the same data supports reliability, energy efficiency, and operational confidence.
Integration with enterprise systems
Power quality insights gain strategic value when they reach MES and ERP layers. Maintenance planning improves when electrical stress patterns inform work orders. Energy reporting becomes more accurate when harmonics and losses are visible.
This integration does not require replacing existing systems. It requires a data layer that aligns timing, context, and meaning. Research-backed architectures show that when this alignment exists, power quality stops being an electrical specialty and becomes an operational asset.
Take control of power quality across your operations
CENTO brings power quality events into a unified industrial digital twin. Voltage data, sensors, alarms, and analytics are aligned in time and context, so engineers stop guessing causes, operations stop chasing symptoms, and managers stop waiting for post-incident explanations.
If you want to go deeper, explore related topics in the Power Quality cluster:
- Power quality monitoring in industrial systems
- Digital twins for electrical and energy analytics
- Predictive maintenance driven by power and process data
- SCADA integration for advanced power quality analysis
To see how this works in a real industrial environment, you can access the CENTO demo and review power quality events directly inside a live digital twin, connected to SCADA data and operational context.
FAQ: Power quality events in industrial systems
Q: What are power quality events in industrial power systems?
A: Power quality events are deviations in voltage, current, or waveform shape that can disrupt equipment operation. Common examples include sags, swells, transients, and harmonics. These events are typically invisible to standard energy meters but detectable with high-resolution monitoring.
Q: Why do voltage sags and harmonics cause equipment downtime?
A:Voltage sags can reset controllers and drives, while harmonics increase heating and control instability. Over time, this leads to unplanned downtime, higher maintenance costs, and reduced equipment lifespan.
Q: How are power quality events detected and analyzed?
A: Detection requires high-frequency sampling of voltage and current waveforms using dedicated sensors or analyzers. Analytics platforms correlate these events with operational data to identify root causes and impacts.
Q: When should industrial facilities monitor power quality?
A: Monitoring is critical when operating sensitive automation, variable-speed drives, EV chargers, or on-site generation. It is also recommended after unexplained failures or recurring process interruptions.
Q: Which industries benefit most from power quality monitoring?
A:Manufacturing, data centers, commercial buildings, utilities, and transport infrastructure benefit the most. These sectors depend on continuous operation and are highly sensitive to electrical disturbances.
Q: How does power quality monitoring improve energy efficiency?
A: By identifying harmonics and unbalanced loads, facilities can reduce electrical losses and optimize compensation systems. This leads to improved energy efficiency and lower operating costs.
Q: Can power quality data be integrated with SCADA and digital twins?
A:Yes. Modern platforms integrate power quality analytics with SCADA systems, historians, and digital twins, providing contextual insight across electrical and process domains.
Q: How can CENTO support power quality analytics?
A:CENTO aggregates high-resolution electrical data, stores it in a centralized historian, and links it with energy balance and operational metrics. This enables actionable insights without replacing existing industrial systems.