12 min. read
Power quality production efficiency is directly influenced by how electrical disturbances propagate into processes, equipment behavior, and downtime risk. In data center environments, power quality is understood through how electrical supply behaves under real operating conditions, not through nameplate values or redundancy diagrams. Stable voltage alone is not enough. What matters is whether the waveform remains intact as loads ramp up, shut down, or synchronize. Modern data centers operate with dense power electronics, fast-changing compute loads, and multiple conversion stages. These conditions expose weaknesses that only appear over very short time windows. As a result, power quality is judged by consistency over time, across phases, and during transitions, not by steady-state snapshots or averaged measurements.
From an engineering perspective, this means focusing on electrical events that last milliseconds but repeat thousands of times. Short-duration sags, swells, and transients often originate from load switching, UPS interactions, or rectifier behavior. At the same time, harmonics and phase imbalance accumulate as GPUs, CPUs, and power supplies operate continuously near their limits. IT equipment reacts strongly to these effects, even when protections never trip. Over time, this leads to hidden stress: components age faster, nuisance alarms increase, and reliability margins erode quietly despite apparent redundancy and sufficient capacity.
Power quality management software goes beyond collecting electrical measurements or displaying dashboards. It qualifies as such only when it captures electrical behavior at sufficient resolution and turns it into explanations operators can act on. This requires time-synchronized measurements taken at multiple points in the electrical hierarchy, from incoming feeders to PDUs and, in some cases, down to rack level. The software must be able to observe fast disturbances as they happen, not infer them from averaged data. Without this temporal depth and spatial coverage, electrical issues remain fragmented and difficult to interpret.
What separates management software from monitoring tools is analytics and context. Event detection and classification pipelines identify sags, transients, harmonics, and imbalance, then relate them to assets, topology, and operating states. Sampling rate, classification accuracy, and how much of the electrical chain is covered all determine usefulness. When these elements are present, teams stop reacting after incidents. They move toward proactive electrical governance, where emerging risks are visible early and mitigation becomes part of routine operations rather than emergency response.
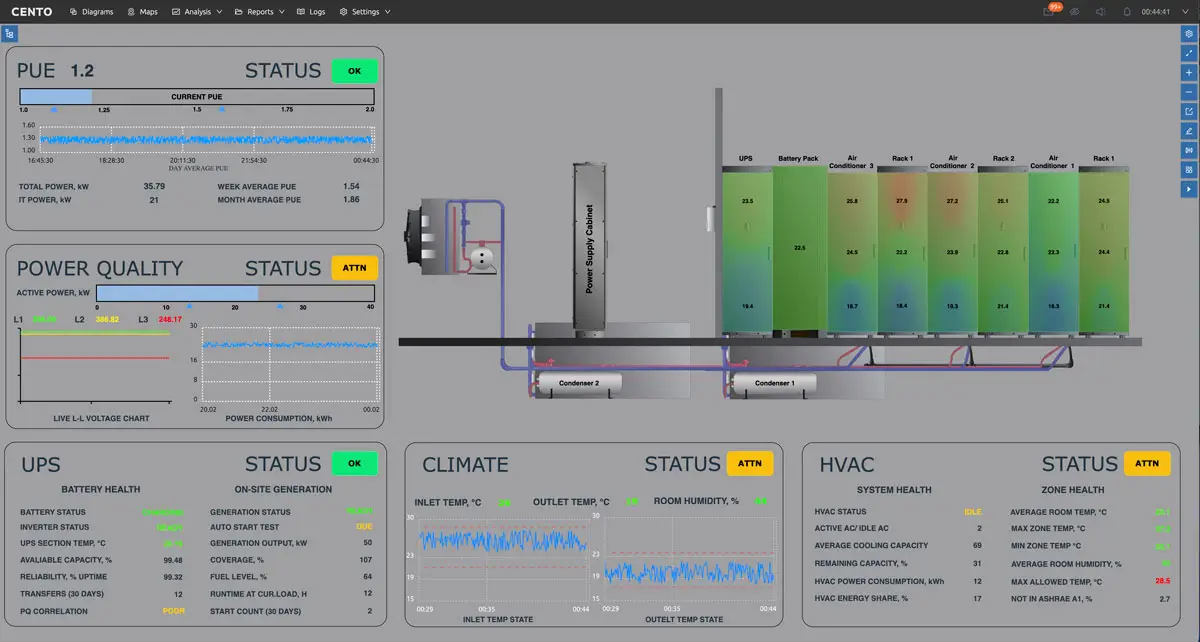
Or read about what is CENTO and how it transforms enterprise operations into a unified digital twin, enabling energy consumption clarity, cost savings, sustainable growth and even more in our article.
Or read about what is CENTO and how it transforms enterprise operations into a unified digital twin, enabling energy consumption clarity, cost savings, sustainable growth and even more in our article.
Modern real-time power quality monitoring does not stream raw waveforms everywhere. Research-backed systems rely on edge devices that process electrical signals locally. These devices calculate power quality indicators continuously and watch for abnormal patterns in voltage, frequency, and harmonics. Only when thresholds are crossed does the system capture high-resolution data or escalate power quality events upstream.
This architecture solves a practical constraint in real-time power quality monitoring: bandwidth and storage. Continuous high-rate streaming from every panel is neither necessary nor sustainable. Instead, low-fidelity power quality metrics provide situational awareness, while targeted high-fidelity snapshots preserve forensic detail when it matters.
SCADA and IoT platforms play complementary roles in real-time power quality monitoring. SCADA remains the operational backbone, interfacing with PLCs, alarms, and HMIs. IoT platforms extend this layer with flexible data pipelines, time synchronization, and scalable analytics. Together, they create a monitoring fabric that delivers real-time power quality visibility without overwhelming infrastructure.
Energy efficiency in data centers is often discussed in terms of cooling optimization or hardware utilization, but power quality plays a quieter role that directly affects operating cost. When electrical waveforms are distorted, losses increase throughout the power chain. Harmonic currents raise conductor and transformer heating, while reactive power and phase imbalance reduce how much of the installed capacity can be used effectively. These effects do not usually trigger alarms, but they steadily erode efficiency under normal operation. Improving power quality production efficiency requires visibility into how short-duration electrical events affect assets and operations over time.
As distortion grows, operators compensate by widening safety margins. Power and cooling systems are run more conservatively to avoid instability, even when nominal capacity appears available. Over time, this behavior shows up in power factor trends, loss indicators, and declining efficiency KPIs. The result is higher energy bills, less usable headroom for new workloads, and infrastructure upgrades that occur earlier than planned, not because demand exceeded design limits, but because power quality reduced what the system could safely deliver.
Effective power quality management starts with how electrical data is acquired. Granularity matters because many relevant disturbances occur at specific points in the electrical hierarchy and over very short time windows. Distributed voltage and current sensing at feeders, PDUs, and sometimes racks provides visibility into how power behaves as it flows through the system. Without this spatial coverage, teams see symptoms downstream but miss where disturbances originate or how they propagate across the facility.
Temporal resolution is equally critical. High sampling rates are required to capture transients, short sags, and harmonic content that averaged measurements smooth out. At the same time, sensing must be compatible with live operations. Non-intrusive measurement techniques allow instrumentation to be deployed without outages or reconfiguration of power paths. Channel density, measurement accuracy, and end-to-end latency determine whether the data can support real-time analysis. When these elements are in place, observability improves without disrupting operations or adding operational risk.
Raw electrical signals rarely provide clarity on their own. Without analytics, high-resolution measurements quickly turn into noise that engineers must interpret manually. Event detection is the first step in making power quality data usable. Signal processing techniques identify deviations across different time scales, from sub-cycle transients to longer voltage variations. This allows the system to flag what actually matters, rather than overwhelming operators with continuous data streams that offer little immediate insight.
Classification adds the second layer of value. Machine learning models group detected events by disturbance type and likely origin, distinguishing between load-driven effects, upstream supply issues, and internal interactions. When these events are correlated with IT load states and facility operations, patterns emerge that explain recurring behavior. Metrics such as detection latency, classification confidence, and false-positive rates determine trust in the system. As confidence grows, teams resolve issues faster and apply targeted mitigation instead of broad, disruptive responses.

Power quality management reaches full value only when insight leads to action. Advanced platforms close this gap by linking analytics to operational control loops. Instead of static alarms, policy-driven logic determines when and how the system should respond to specific disturbance patterns. This may involve escalating alerts, adjusting operating modes, or preparing mitigation steps before conditions worsen. The objective is not full automation, but timely, consistent responses that reduce reliance on manual intervention during stressful events.
Effective control also requires coordination across systems. Responses may involve UPS behavior, generator readiness, or load management actions, all of which must remain aligned. Before any actuation, simulation and what-if analysis help evaluate potential outcomes under current conditions. Metrics such as response time, avoided incidents, and post-event stability indicate effectiveness. When these loops are in place, disturbances are contained faster, and the overall electrical system becomes more resilient under variable and demanding workloads.
AI training and HPC workloads have introduced a new class of electrical behavior inside data centers. Instead of gradual load changes, power demand now rises and falls in sharp, synchronized phases as compute jobs move through training or processing cycles. Traditional monitoring systems average these dynamics away, making the electrical profile appear stable when it is not. As a result, operators see downstream symptoms without understanding the repetitive power patterns that drive them.
These cyclic power swings interact directly with electrical infrastructure. Ramp rates stress upstream supply, while repeated peaks and drops challenge UPS control stability. Over time, this creates uncertainty for planning and grid coordination, even when total energy consumption remains within expectations. By identifying ramp rates and recurring power signatures, power quality analytics make these dynamics visible. Architects can then align IT scheduling, electrical design, and operational limits based on evidence rather than conservative assumptions.
Not all electrical problems announce themselves with alarms or trips. In many data centers, power quality degrades slowly as load density increases and equipment ages. Harmonic content grows incrementally, balance drifts between phases, and power factor declines in small steps that are easy to overlook. Point-in-time measurements rarely capture this progression, so teams assume the system remains healthy until a failure exposes the accumulated stress.
Trend-based analytics change this visibility. By tracking long-term movement against defined deviation thresholds, engineers can see when electrical behavior is drifting away from established baselines. This supports predictive electrical maintenance rather than reactive repair. Instead of discovering problems through unanticipated failures, teams intervene earlier, extending asset life and protecting reliability margins. The outcome is fewer emergency responses and a more controlled approach to managing electrical aging in high-demand environments.
Power quality insights lose much of their value when they remain isolated from day-to-day operations. In real facilities, operators already rely on SCADA and BMS platforms to supervise power, cooling, and safety systems. For power quality software to be effective, it must exchange data with these existing layers rather than operate as a parallel tool. This includes sharing events, alarms, and contextual signals with protection systems and control interfaces used on the floor.
Interoperability also depends on a shared understanding of assets and topology. When electrical measurements are mapped to the same equipment hierarchy used by SCADA and BMS, data becomes consistent across systems. Integration latency and data alignment determine whether responses can be coordinated in real time. When integration is done well, teams gain a coherent operational view, enabling faster decisions and reducing fragmented workflows during electrical events.
Digital twins are only as useful as the data that feeds them. Without electrical behavior, many models remain static representations of layout or capacity. Power quality data adds realism by synchronizing virtual models with how electricity actually behaves under load. Real-time alignment between physical measurements and the digital twin allows the model to reflect transient events, harmonic conditions, and operating states that influence performance but are otherwise invisible in design tools.
This electrical realism enables meaningful simulation. Engineers can test how load changes, scheduling decisions, or mitigation strategies affect system stability before acting in the live environment. Model accuracy and prediction error bands determine confidence in these scenarios. When power quality is included, planning becomes safer and more proactive. Teams evaluate options without risking outages, reducing trial-and-error adjustments and improving long-term operational optimization.
Monitoring-only tools give teams a view of what is happening, but little guidance on what to do next. Dashboards show voltages, currents, and alarms, yet interpretation is left to human judgment under time pressure. During incidents, this often means scrolling through trends, comparing screenshots, and debating possible causes. Visibility exists, but decision-making remains slow and inconsistent, especially when experienced staff are not immediately available.
Analytics-driven platforms change the role of data. Active classification engines identify disturbance types and recurring patterns, reducing the time needed to understand what went wrong. Metrics such as time-to-diagnosis and incident recurrence improve because responses become repeatable rather than improvised. When analytics are absent, organizations stay in a reactive mode. As maturity increases, teams rely less on manual analysis and more on structured insight to guide reliable, timely decisions.
Embedded hardware meters are essential for capturing electrical measurements, but on their own they provide a narrow view. Single-channel or rack-level devices report local conditions without explaining how those signals relate to the rest of the power system. As deployments grow, teams accumulate data from many points but lack a unified way to interpret it. Each meter becomes another isolated source, increasing monitoring effort without improving understanding.
Software-centric platforms address this gap by centralizing analytics and orchestration. Data from many meters is aligned in time, mapped to topology, and analyzed as a system rather than as individual channels. Scalability depends less on adding devices and more on managing information coherently. Without this layer, integration effort rises and insights remain fragmented. With it, operational costs fall as investigations shorten and electrical behavior becomes easier to manage at scale.
Organizations invest in power quality software when electrical uncertainty starts to affect business outcomes. The primary drivers are risk reduction and cost control, not technical curiosity. Improved reliability comes from understanding how disturbances develop and how often they repeat, rather than reacting to isolated incidents. Efficiency improves as losses, imbalance, and conservative operating margins become visible and measurable. Planning accuracy increases because decisions are based on observed behavior instead of assumptions about how the system “should” perform. When power quality production efficiency is measurable, teams can link electrical behavior directly to reliability and cost outcomes.
From a management perspective, value is reflected in avoided downtime, steadier efficiency metrics, and longer asset life. These indicators strengthen the business case for infrastructure investment by shifting conversations from anecdotal failures to measurable impact. When electrical behavior is predictable, organizations can justify upgrades, defer unnecessary spending, and align capital planning with actual operational risk rather than worst-case scenarios.
ndustrial platforms approach power quality management as one layer of operational intelligence rather than a standalone function. Electrical data is ingested alongside IT workload signals and facility telemetry through unified data pipelines. This alignment allows analytics to evaluate power behavior in the context of how the data center is actually operating. Visualization and analysis are built on shared asset and topology models, so electrical events are immediately meaningful to engineers and operators using the same system.
This architecture reduces fragmentation. Instead of deploying separate tools for energy, reliability, and operations, organizations extend an existing platform to include power quality insight. Deployment scope and data coverage can expand gradually without redesigning the system. As a result, adoption is faster, integration effort is lower, and power quality becomes part of routine decision-making rather than a specialized, siloed capability.
Most organizations adopt power quality management incrementally rather than through a full-scale rollout. The typical starting point is monitoring critical electrical feeds or high-risk zones where disturbances are most likely to affect operations. This phase establishes a baseline and builds trust in the data without disrupting existing workflows. Early results often focus on faster incident analysis and improved visibility into recurring electrical behavior.
As confidence grows, analytics and control capabilities are added in phases aligned with operational priorities. Integration expands progressively to SCADA, MES, and ERP systems, connecting power quality insight to alarms, maintenance processes, and planning tools. Each integration touchpoint increases value while limiting risk. This staged approach reduces adoption friction, shortens time to value, and allows teams to scale capability at a pace matched to organizational readiness.
Get direct access to the CENTO demo environment and evaluate:
Whether your current monitoring tools miss critical disturbances
How analytics-driven platforms compare to monitoring-only solutions
How power quality management integrates with your SCADA, BMS, or DCIM stack
Request live demo access here:
https://www.centosoftware.com/demo
Or fill in the form at the bottom of this page to schedule a technical walkthrough and get answers tailored to your environment from our support team.
A: Data center power quality management software is a platform that monitors, analyzes, and explains electrical disturbances in real time across a data center’s power infrastructure.
Unlike basic monitoring tools, it captures high-resolution voltage and current data, detects sags, harmonics, and transients, and correlates events with assets, topology, and operating states. The goal is to prevent downtime, reduce energy losses, and improve infrastructure reliability.
A: Power quality is critical in modern data centers because AI and high-performance computing workloads create fast, synchronized power demand changes.
These rapid load ramps expose weaknesses in UPS systems, switchgear coordination, and upstream supply. Even when redundancy is in place, waveform distortion can trigger resets, protection trips, and unstable transfer behavior. Over time, this reduces SLA compliance and operational confidence.
A: Poor power quality reduces uptime by causing short-duration electrical disturbances that disrupt equipment without causing full outages.
Voltage sags, harmonics, and transients can lead to:
These events accumulate and erode reliability margins even when infrastructure appears healthy.
A: Power quality directly affects energy efficiency by increasing electrical losses across transformers, conductors, and power electronics.
Harmonic distortion raises thermal loading. Phase imbalance reduces usable capacity. Reactive power lowers effective power factor. These inefficiencies increase operating costs and reduce available headroom for new workloads.
A:
Power quality problems are detected using high-resolution, time-synchronized electrical measurements combined with analytics.
Effective detection requires:
Monitoring at feeders, PDUs, and critical loads
High sampling rates to capture millisecond events
Event detection and classification algorithms
Correlation with IT load states
Without analytics, averaged SCADA data often hides short-duration disturbances.
A: Power quality software integrates with SCADA by streaming real-time events and alarms into operational dashboards. It integrates with digital twins by synchronizing electrical behavior with asset topology and operating states.
In a digital twin environment, power quality data enables:
This integration transforms electrical data into operational intelligence.
A: Power quality monitoring shows electrical measurements and alarms. Power quality management analyzes, classifies, and correlates disturbances with operational context.
Monitoring answers “what happened.”
Management software answers “why it happened” and “what to do next.”
Advanced platforms integrate analytics, response logic, and digital twin models to enable proactive electrical governance.
A: Power quality software integrates with SCADA systems by streaming real-time events and alarms into operational dashboards.
When integrated with a digital twin, electrical behavior is mapped to assets, topology, and operating states. This allows engineers to simulate load changes, evaluate mitigation strategies, and test infrastructure decisions before applying them live.
A: AI and HPC workloads create rapid, cyclical power demand fluctuations that stress electrical infrastructure.
These fast ramp rates challenge UPS control stability and upstream supply coordination. Traditional monitoring systems average these fluctuations and miss their impact. Power quality analytics detect recurring patterns and quantify their operational risk.
A: Power quality management software delivers measurable operational improvements:
It transforms electrical uncertainty into structured, actionable insight.
A: Organizations should begin by monitoring critical electrical points and establishing a high-resolution baseline.
Next steps typically include:
A phased approach reduces integration risk while increasing operational visibility.
Share your details and let’s start the conversation.
Share your details and let’s start the conversation.
Launch demo to discover some of product features.
Login: demo
Password: demo
If you need more information and guided demo – contact our team to book a call.