Electricity has moved from a fixed overhead line item to one of the top three variable costs at most manufacturing and process facilities. Tariffs have changed. Demand charge structures have become more complex. Regulatory frameworks, from the EU Energy Efficiency Directive to national ISO 50001 adoption programs, now require facilities to document consumption, set baselines, and report demonstrated improvement on defined energy performance indicators. That combination of financial pressure and compliance obligation is why energy management has shifted from a sustainability function to an operational one.
The problem most facilities face is not a shortage of data. Substations record load. PLCs log motor runtime. SCADA historians accumulate tag data continuously. Building management systems track HVAC draw. What is missing is a layer that translates those raw streams into answers to operational questions: Which line is consuming more than its production-adjusted baseline right now? Is the compressor running during peak-tariff hours when it does not need to? Is reactive power drawing a penalty charge that could be corrected at the panel? Without that translation layer, energy reviews happen monthly in accounting, not in real time in the control room.
This article explains what an energy management system is, how it works at an architectural level, which systems it needs to connect to, what metrics it tracks, and how facilities can implement one without replacing the infrastructure they already operate.
Why energy data alone is not enough
The fragmentation problem in industrial energy data
Energy data in most plants lives in at least four separate systems. The substation SCADA records real and reactive power at the feeder level. The MES records production orders, shift schedules, and output tonnage. The building management system logs HVAC and lighting loads. The ERP books the utility invoice. None of these systems shares a common timestamp resolution, a common equipment hierarchy, or a common unit of energy intensity. An engineer trying to answer whether Line 3 consumed more energy per kilogram of product this week than last week must pull exports from three systems, align them manually, and perform the ratio calculation in a spreadsheet.
That manual process is slow. More importantly, it is retrospective. By the time the analysis is complete, the production run that caused the variance has ended, and the root cause, whether a chiller running at part load, a compressor control valve stuck open, or a furnace setpoint drift, has either corrected itself or caused additional cost.
Why point solutions have not closed the gap
Submetering projects add granularity at the circuit level. Power analyzers give accurate reactive power and harmonic data at individual panels. Energy dashboards present trend charts. Each of these tools addresses one layer of the problem, but none connects energy consumption to its operational cause in context. A submeter shows that compressed-air consumption on a given header is elevated. It does not show that a production order requiring high-pressure cycling started forty minutes ago, which would make the reading expected rather than anomalous. Without production context, every spike looks like a fault candidate.
This is the structural gap an energy management system closes. Not more data, but data made operational through context.
The regulatory pressure making this urgent
ISO 50001 requires organizations to establish energy performance indicators, set baselines tied to relevant variables such as production volume or weather conditions, and track improvement against those baselines in an ongoing management review cycle. The EU Energy Efficiency Directive places mandatory audit and reporting obligations on large enterprises. Many national grid operators now offer demand response programs that require near-real-time load visibility and controllable response capability, something that is not achievable through monthly spreadsheet reviews. The business case for an EMS has therefore shifted: it is no longer primarily about identifying savings. It is about maintaining the documentation, reporting, and response capability that regulators and grid operators now require as a baseline operating condition.
What an energy management system actually does
Core functions
An energy management system performs four core functions. First, it aggregates consumption data from meters, analyzers, PLCs, and SCADA historians into a single time-series store with a consistent equipment hierarchy. Second, it contextualizes that data by linking consumption readings to the operational state that produced them, specifically the production order, the machine mode, the shift, and the ambient conditions relevant to the load. Third, it calculates energy performance indicators normalized to relevant variables so that comparisons across time periods, product types, or lines are valid. Fourth, it generates alerts when consumption deviates from the expected range for the current operational context.
What separates an EMS from a dashboard
A dashboard displays values. An EMS computes meaning. The difference is the normalization and baseline logic. When a facility runs three shifts on an energy-intensive product and then switches to a lighter product on two shifts, raw consumption will drop. A dashboard shows lower consumption. An EMS shows whether energy intensity per unit of output improved, stayed flat, or worsened after the product change, because it normalizes consumption against the production variable. That distinction determines whether energy management is reactive, reading last month's utility bill, or operational, acting on deviations during the shift that produced them.
Alerting and control integration
Operational EMS deployments go beyond monitoring. When consumption on a specific feeder crosses the threshold that would push peak demand into a higher tariff tier, the system can trigger an alert to the control room or, in more integrated deployments, initiate a load-shedding sequence on non-critical equipment. Similarly, when power factor at a panel drops below the contractual threshold, an automatic capacitor bank switching command can correct it before the reactive power penalty accumulates. These functions require the EMS to have write-capable integration with the control layer, not just read access to historian tags.
The architecture behind a working EMS
Data acquisition layer
At the lowest level, an EMS collects data from physical measurement points: utility-grade revenue meters at the point of supply, submeters at feeder and panel level, power quality analyzers at large motor and drive installations, and pulse or analog outputs from process instruments that represent energy-consuming activity such as compressed-air flow, steam flow, and chilled-water flow. Communication protocols at this layer typically include Modbus RTU and TCP, M-Bus for heat and water meters, DLMS/COSEM for smart meters, and OPC UA where modern PLCs or edge devices are present. The data acquisition layer is responsible for reliable, timestamped ingestion at a resolution appropriate for the use case, typically one-minute intervals for demand management and fifteen-minute intervals for baseline analysis, though some power quality applications require sub-second sampling.
Contextualization and normalization engine
Raw meter data becomes an energy performance indicator only when it is divided by the relevant production variable for that time interval. That requires the EMS to know, for every fifteen-minute window, what the facility was producing, at what rate, on which line, under which environmental conditions. This information lives in the MES and, at a higher level, in the ERP. The contextualization engine joins the energy time-series to the production time-series, computes the normalized indicator, and compares it to the established baseline for that product-line-shift combination. The baseline itself must account for relevant variables: ambient temperature affects chiller load, product mix affects furnace energy intensity, shift patterns affect fixed losses. A system that compares this week's consumption to last week's without adjusting for these variables produces misleading conclusions.
Reporting and compliance layer
At the top of the stack, an EMS generates the reporting outputs that operations managers, energy managers, and compliance teams need. This includes consumption and intensity trend reports aligned to ISO 50001 review cycles, demand charge forecasts that show expected peak demand based on current trajectory, power quality reports covering power factor, voltage unbalance, and harmonic distortion at monitored points, and audit trail exports that satisfy regulatory documentation requirements. The reporting layer should support both scheduled automated exports and on-demand queries, because compliance auditors and operational managers ask different questions on different timescales.
Have something in mind to discuss?
We're here to help you find the answers. Let's talk.
How an EMS connects to SCADA, MES, and ERP
A standalone energy meter network is not an energy management system. The system-level integration that connects consumption data to production context is what turns measurement into management. The table below maps each major industrial system to the data it holds, what the EMS extracts from it, how that data is normalized, and what the integration enables.
| System | Raw data the system produces | What the EMS extracts | How the unified model normalizes it | Effect on energy management |
|---|---|---|---|---|
| SCADA / Historian | Tag values: feeder amps, motor runtime, drive speed, valve position, process temperatures | Timestamped load readings at equipment level; machine state signals (running, idle, fault) | Aligns load readings to machine operating mode so idle consumption is separated from productive consumption | Enables anomaly detection against mode-specific baselines; removes false positives from planned operational states |
| MES | Production orders, product codes, batch quantities, shift schedules, line assignments, yield data | Production volume per interval, product type, active line, shift identity | Divides energy consumption by production quantity to compute energy intensity per unit of output | Supports valid cross-period comparisons normalized to production mix; feeds ISO 50001 EnPI calculations |
| ERP | Utility invoices, tariff structures, cost center allocations, maintenance work orders | Tariff tier boundaries, demand charge thresholds, cost allocation rules | Maps consumption by feeder and time-of-use period to the correct tariff rate and cost center | Enables cost allocation by production order or product line; closes the loop between operational decisions and financial outcomes |
| Building Management System (BMS) | HVAC setpoints and runtime, lighting schedules, ambient temperature sensors | Non-production energy loads; ambient temperature as a relevant variable for normalization | Separates facility base load from production-driven load; uses ambient data to adjust HVAC-sensitive baselines | Prevents HVAC-driven consumption changes from distorting production energy intensity trends |
| Power Quality Analyzers | Voltage, current, power factor, harmonic spectra, reactive power at panel level | Power factor values by panel and interval; harmonic distortion events | Compares power factor to contractual threshold to quantify reactive power penalty exposure | Triggers capacitor bank switching or flags penalty-causing equipment for corrective action |
The integration challenge is not the individual connections. Most of these systems already expose data through OPC UA, Modbus, REST APIs, or database queries. The challenge is the join layer: creating a consistent equipment hierarchy that links a SCADA tag, a MES line identifier, an ERP cost center, and a meter point to the same physical asset. Without that shared context model, the data from each system describes a different object using a different naming convention, and integration produces noise rather than insight.
Key metrics an EMS tracks and why they matter
Energy performance indicators (EnPIs)
ISO 50001 defines an energy performance indicator as a quantitative measure of energy performance as defined by the organization. In practice, an EnPI is a ratio: energy consumed divided by a relevant variable that explains most of the variation in that consumption. For a compressor house, the relevant variable is compressed-air output volume. For a furnace line, it is tonnes of throughput. For a packaging line, it is units produced. The baseline is established during a defined reference period under documented operating conditions, and subsequent performance is measured as deviation from that baseline, adjusted for changes in the relevant variable. Tracking EnPIs rather than absolute consumption is what makes energy performance comparable across months, years, and product changes.
Demand and tariff metrics
Peak demand, measured in kilowatts over a defined interval, typically fifteen or thirty minutes depending on the utility contract, determines the demand charge component of the electricity bill. Demand charges can represent thirty to fifty percent of a total electricity invoice at facilities with large motor loads and variable production schedules. An EMS tracks rolling demand against the tariff tier boundary in real time, forecasts whether the current load trajectory will set a new peak for the billing period, and provides the lead time needed to shed non-critical loads before the interval closes. Power factor, the ratio of active to apparent power, is a second tariff-relevant metric. Many utilities impose penalties when power factor falls below a contractual threshold, typically 0.90 to 0.95, because low power factor indicates reactive current that loads the distribution network without delivering useful work.
Consumption anomaly detection
Beyond normalized performance indicators, an EMS tracks absolute consumption deviations against mode-specific baselines for individual equipment groups. A compressed-air system running at expected pressure but consuming fifteen percent more power than the baseline for the current demand level is a candidate for leak investigation, worn seals, or a control valve not returning to the correct position. A chiller consuming above baseline during night hours when production has stopped indicates either a setpoint control fault or a load that should not be active. These anomaly signals are operational, meaning they surface in the control room during the shift, not in the accounting report at month-end.
EMS use cases across industrial sectors
Continuous process industries
In cement, steel, chemicals, and pulp-and-paper production, energy typically represents the largest variable cost after raw materials. Kilns, furnaces, electric arc furnaces, and large compressor installations run continuously, which means small deviations in energy intensity compound quickly into significant cost. An EMS in a continuous process environment focuses on specific energy consumption per tonne of product as the primary EnPI, demand management to avoid peak-tariff surcharges during high-production periods, and early detection of thermal efficiency degradation in furnaces and kilns before it affects product quality or requires an unplanned shutdown.
Discrete and batch manufacturing
In automotive, electronics, food and beverage, and pharmaceutical production, the energy management challenge is different. Production schedules change frequently, product mix varies, and machines cycle between active, idle, and standby states within a single shift. The EMS must disaggregate consumption by machine state to separate productive energy use from idle losses, which in some facilities represent a substantial share of total consumption. Shift-level reporting that links energy intensity to the specific products run during that shift gives operations managers the data to make scheduling decisions that reduce energy cost without affecting output.
Commercial and multi-site facilities
For facilities with large HVAC, lighting, and refrigeration loads, whether food distribution centers, hospitals, or data centers with process cooling requirements, the EMS use case centers on base-load optimization and demand response participation. These facilities have predictable load profiles that can be modeled against weather and occupancy variables, making it feasible to forecast demand, optimize chiller staging, and participate in grid-level demand response programs that provide revenue in exchange for controllable load reduction during grid stress events.
Try CENTO in action. Run our demo.
Launch demo to explore CENTO features or book a guided walkthrough.
Implementing an EMS without replacing existing infrastructure
Start with the integration inventory
Before selecting software or adding meters, a practical EMS implementation begins with mapping what already exists: which meters are installed and communicating, which SCADA tags are relevant to energy consumption, what data the MES already records at the interval level, and which utility tariff structure governs the facility's largest cost drivers. This inventory typically reveals that most of the required data already exists in some form. The gap is not instrumentation. It is the absence of a system that connects those sources into a consistent operational model.
Protocol bridging and legacy compatibility
Modern EMS deployments must accommodate a mixed protocol environment. Older meters and PLCs communicate over Modbus RTU. Utility smart meters use DLMS/COSEM or pulse outputs. Newer equipment exposes OPC UA endpoints. Heat and water submeters use M-Bus. A practical integration architecture uses protocol gateways or edge devices to convert these signals to a common transport, typically OPC UA or MQTT, before ingestion into the EMS platform. This approach preserves existing hardware investments and avoids the capital expense of replacing functional measurement infrastructure.
Phased rollout and baseline establishment
ISO 50001 implementations and practical EMS deployments both benefit from a phased approach. The first phase connects the highest-impact measurement points, typically the utility supply feeders and the two or three largest energy-consuming systems, and establishes baselines over a representative operating period. The second phase adds production context by integrating MES data and computing normalized EnPIs. The third phase extends to anomaly alerting, demand management, and compliance reporting. This sequence produces operational value at each stage rather than requiring full deployment before any benefit is realized.
What unified energy visibility changes operationally
From monthly review to shift-level response
The most significant operational change an EMS produces is the compression of the feedback loop. When energy performance data is available at shift level, normalized to the products run during that shift, operations supervisors can identify and respond to deviations within hours rather than weeks. A shift supervisor who sees that Line 2 ran at 1.8 kWh per unit against a baseline of 1.5 kWh, and can correlate that deviation to a specific machine that entered a degraded operating state during the shift, has actionable information. The same information arriving in a monthly energy report is historical rather than operational.
Maintenance and reliability integration
Energy consumption is a leading indicator of equipment condition. A motor drawing more current than the baseline for its load point is a candidate for bearing degradation, insulation deterioration, or mechanical misalignment. A compressor delivering the same pressure at higher energy input is a candidate for valve wear or reduced volumetric efficiency. When the EMS is connected to the maintenance system, anomalous energy readings can automatically generate work order suggestions or feed the condition data that a predictive maintenance model uses to estimate remaining useful life. This connection closes the loop between energy performance and equipment reliability in a way that neither system achieves independently.
Cost allocation and capital decision support
When energy consumption is allocated to production orders and product lines rather than aggregated at the facility level, the true energy cost of each product becomes visible. That information changes capital allocation decisions. A product line that appears profitable at standard costing may show a different margin when its actual energy intensity is applied. Conversely, a capital investment proposal for a more efficient compressor or furnace can be supported with site-specific consumption data rather than vendor efficiency claims, making the business case more credible and the expected return more predictable.
Learn how CENTO turns this architecture into real operational results
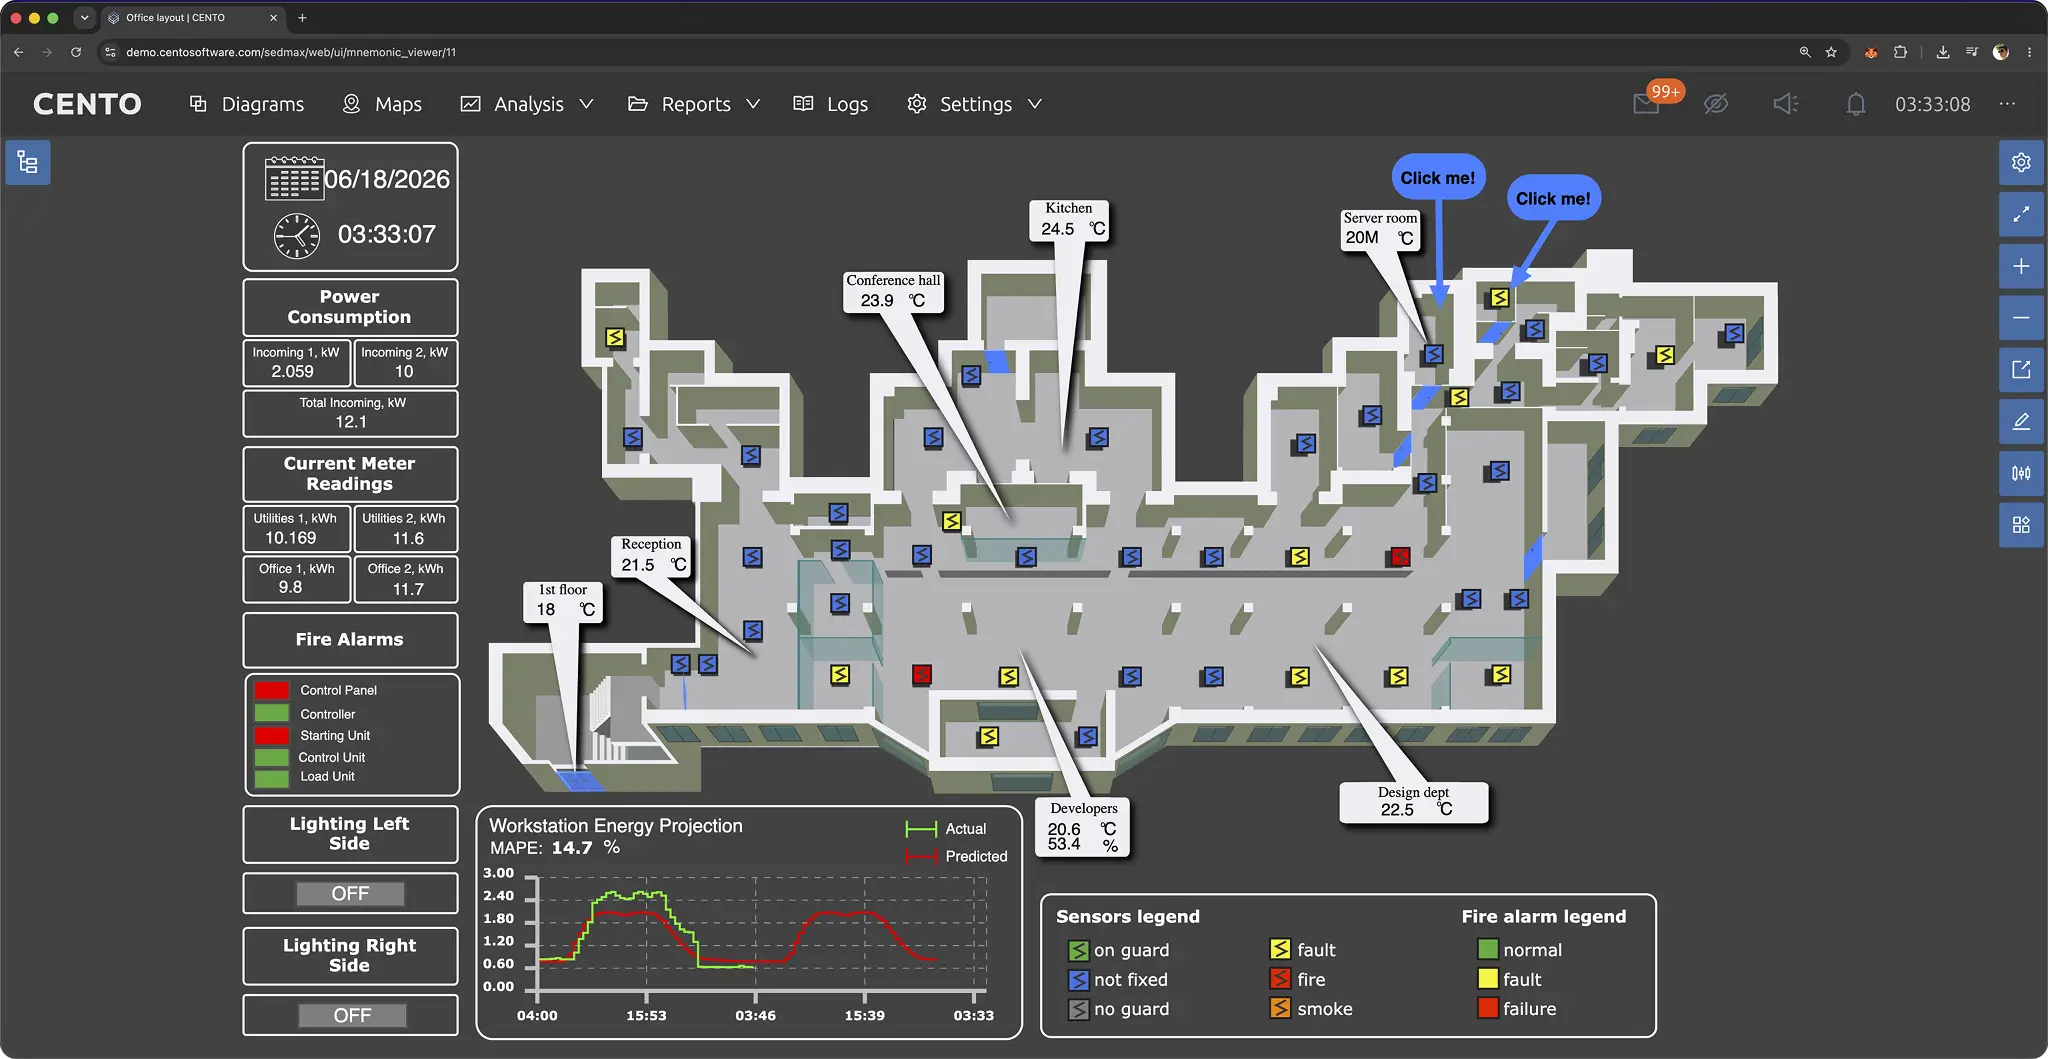
The architecture described in this article is exactly where CENTO fits: it connects energy meters, SCADA signals, equipment states, production context, and reporting logic inside one industrial software environment. Instead of treating energy data as a separate reporting stream, CENTO brings it into the same operational model used for monitoring, control, analysis, and decision support.
Start with the CENTO product overview to see how the platform combines real-time monitoring, energy metering, power quality analytics, digital twins, and industrial data tools in one system. For facilities focused on consumption structure, losses, and ISO 50001 reporting, the Energy Balance module shows how CENTO collects data from meters, sensors, and automation systems, then turns it into real-time energy maps and operational reports.
For broader utility and resource accounting, the Industrial energy metering and reporting page explains how CENTO tracks electricity, gas, water, steam, compressed air, raw materials, and runtime data across a facility. When the task is to connect these measurements to asset structure and production context, the Unified Data Platform provides the shared data layer that helps turn fragmented signals into a consistent industrial model.
Energy management also depends on electrical reliability. The Power Quality Control module supports real-time monitoring of voltage, harmonics, imbalances, and other electrical parameters that affect equipment health, downtime risk, and tariff-related costs. For a practical view of how live plant data supports energy decisions, read the article on energy optimization with SCADA and ERP integration.
To see how this works in real deployments, explore CENTO case studies, including projects for mining, energy, metals, and data center operations. If you want to evaluate how CENTO can connect to your existing infrastructure, launch the demo or book a call with the team.
Frequently asked questions
What is an energy management system in industrial settings?
An energy management system in an industrial context is software that collects consumption data from meters, analyzers, and control systems, connects it to production context from MES and ERP systems, computes normalized energy performance indicators, and generates alerts or reports when performance deviates from established baselines. It is distinct from a simple energy dashboard because it normalizes consumption against the operational variables that drive it, making comparisons valid across different production periods and product mixes.
How is an EMS different from a SCADA system?
SCADA systems are designed for real-time process monitoring and control. They collect and display tag values, generate process alarms, and support operator decisions about process states. An EMS uses some of the same data sources but applies different logic: normalization, baseline comparison, and energy performance calculation. An EMS also integrates data from production, maintenance, and financial systems that a SCADA system does not typically access. The two systems are complementary rather than competing.
Which systems does an EMS need to integrate with?
A functional EMS integrates with at minimum the SCADA historian for equipment-level consumption data, the MES for production volume and schedule data that enables normalization, and the utility metering infrastructure for supply-point totals. Integration with the ERP adds tariff cost allocation and work order connectivity. Integration with power quality analyzers adds reactive power and harmonic data relevant to tariff penalties and equipment health. The value of the system scales with the breadth and quality of these integrations.
What is an energy performance indicator and why does ISO 50001 require one?
An energy performance indicator, or EnPI, is a ratio that expresses energy consumption relative to a relevant variable such as production volume, tonnes of throughput, or occupancy hours. ISO 50001 requires facilities to define and track EnPIs because absolute consumption figures are not comparable across periods with different production levels or product mixes. An EnPI makes it possible to determine whether the facility is genuinely using energy more or less efficiently, independent of changes in production activity. Without EnPIs, apparent consumption reductions may simply reflect reduced output rather than improved efficiency.
Can an EMS be implemented without replacing existing meters or PLCs?
Yes. Most EMS implementations are additive rather than replacement projects. Existing meters that communicate over Modbus, M-Bus, or pulse outputs can be connected to the EMS through protocol gateways. Existing SCADA historians can be queried via OPC UA or database connectors. The EMS adds the contextualization and normalization logic above the existing data layer without requiring hardware replacement. The main prerequisite is that the existing meters provide sufficient granularity at the circuit or feeder level to support the intended use cases.
How long does it take to establish a valid energy performance baseline?
ISO 50001 guidance recommends that a baseline period be long enough to represent the normal variation in the relevant variables, typically production volume and ambient conditions. In practice, this means a minimum of twelve months for facilities with seasonal HVAC loads or significant seasonal production variation, and at least three to six months for facilities with more stable operating patterns. The baseline period should include the full range of production rates, product mixes, and ambient conditions the facility normally experiences so that the baseline is valid for future comparison under any operating condition.
What is the difference between demand management and energy efficiency in an EMS context?
Energy efficiency refers to producing the same output with less total energy consumption, typically measured through EnPIs over time. Demand management refers to controlling the rate at which energy is consumed during short intervals to avoid peak demand charges or tariff tier escalations, regardless of total consumption. Both are functions of a mature EMS. A facility can be efficient in total consumption terms but still incur avoidable demand charges if large loads start simultaneously. Demand management and efficiency programs address different cost drivers and require different operational responses.
Sources
This article is based on established industrial standards, protocol specifications, and publicly documented regulatory frameworks. Specific source documents will be added to this reference list as primary research is incorporated into subsequent revisions. The technical content reflects current practice under ISO 50001:2018, IEC 61968/61970 (Common Information Model), the EU Energy Efficiency Directive (2012/27/EU and 2023 recast), and published protocol specifications for Modbus, OPC UA, M-Bus (EN 13757), and DLMS/COSEM.