Heating and cooling systems alone account for up to 55% of total building energy in most facilities. That single figure is striking, not because it surprises energy managers, but because most sites already have meters watching it happen. The question is whether anything acts on what those meters see.
A monitoring system answers the question of how much. A management system answers the question of when, why, and what to do next. That functional gap, between passive visibility and active optimization, is where energy budget overruns form, and where the return on digital infrastructure lives or dies.
The distinction matters more now than it did five years ago. Time-of-use tariffs have widened the spread between peak and off-peak electricity costs. Renewable generation has made grid carbon intensity variable by the hour. Fixed operating schedules that were acceptable under stable pricing expose facilities to avoidable cost every time conditions shift.
This article traces that functional difference precisely: what each system architecture does, where the measurable gains appear, and how industrial and commercial sites are currently deploying management capabilities on top of existing monitoring infrastructure.
Why does confusing monitoring with management cost industrial facilities real money?
The cost of treating monitoring as sufficient shows up in a specific operational pattern: a site invests in metering, installs dashboards, and watches consumption data accumulate, but the operational decisions remain on fixed schedules that were set during commissioning and rarely revisited.
Most existing thermal energy storage systems operate on exactly this basis. Fixed charge-discharge schedules cannot respond to cooling load variation, weather shifts, or tariff tier changes. The result is predictable: ice reserves run low before the most expensive peak hours arrive, chillers fire during super-peak windows, and the entire economic case for the TES investment erodes. Extensive manual investigation is required to diagnose what went wrong, but the root cause is almost always that the system was monitored, not managed.
Demand Response: A mechanism that allows consumers to adjust load reduction or shift energy usage according to peak and trough differences in electricity and thermal demand prices, optimizing overall system coordination and energy efficiency.
Standard rule-based building controllers share the same structural weakness. They lack dynamic information about actual building energy state and cannot exploit thermal dynamics for efficient control. Oversized HVAC systems are a direct downstream consequence: engineers size equipment for worst-case conditions because the control layer cannot adapt to real-time load variation. A monitoring system captures that oversizing as a data point. A management system prevents it from forming in the first place.
The financial exposure compounds across each tariff period. A site that monitors but does not manage knows it paid peak rates for energy that could have been pre-loaded or shifted. It simply cannot do anything about it automatically.
What does an energy monitoring system actually do?
The installed base of smart meters grew from a standing start to approximately 729 million units globally between 2010 and 2019, a growth rate that reflects how quickly measurement infrastructure spread across industrial and commercial portfolios. The global smart meter market was valued at US$10.5 billion in 2020 and is projected to reach US$15.2 billion by 2026, growing at 6.7% annually.
What that infrastructure delivers is measurement. An energy monitoring system collects consumption readings from meters, sensors, and PLCs, surfaces them through dashboards, and enables reporting against targets. It answers operational questions about what happened and how much was consumed across defined periods.
Building Performance Simulation (BPS): Tools that create virtual representations of buildings to estimate energy usage profiles under various conditions, requiring meticulous audits of architectural and operational details plus a laborious calibration process.
The monitoring layer's structural limitation is not data volume. Energy data privacy and security concerns already prevent many utilities and operators from sharing meter data freely, which creates data scarcity even in environments with dense metering. More practically, conventional regression-based forecasting models require months of historical readings to capture seasonal and behavioral patterns adequately. A monitoring system that feeds those models is useful, but it remains passive until something interprets the output and acts on it.
Monitoring systems are also blind to context. A meter reading that shows elevated consumption at 09:00 on a Tuesday tells an operator what happened. It does not distinguish between a scheduled production peak, an HVAC system that failed to pre-condition correctly, or a compressor running during a tariff window it should have avoided. Turning those readings into decisions requires a different functional layer.
How does an energy management system go beyond visibility to take action?
An energy management system closes the loop that monitoring leaves open. Rather than recording what the system consumed, it modifies when and how systems operate based on real-time conditions, forecast signals, and cost optimization logic.
Model Predictive Control is one of the clearest illustrations of this difference in practice. When system dynamics are accurately characterized, MPC can reduce building energy demand by up to 30% compared to rule-based controllers, not by consuming less energy in absolute terms, but by shifting consumption away from expensive periods, pre-conditioning spaces before occupancy, and avoiding unnecessary peak exposure. The gain comes from the decision layer, not from the measurement layer.
Thermal Energy Storage (TES): A system that charges ice storage during off-peak hours at night and provides cooling during peak hours during the day; the ice storage tank performs as a thermal battery to shift loads from the day to the night.
Real-time pricing signals feed directly into this logic. When carbon trading mechanisms raise the marginal cost of fossil-fuel generation, the management layer responds by shifting dispatchable loads toward periods of higher renewable availability. Real-time pricing-driven demand response shifts electrical loads away from peak hours, reducing curtailed renewable power while keeping total consumption unchanged. The monitoring layer would record the same energy flow either way. The management layer changes when it flows.
MPC does have a known vulnerability: its performance degrades when forecasts are inaccurate, and for long-horizon operations where predictions become unreliable, forecast-dependent control produces suboptimal or unstable dispatch decisions. This is why emerging energy management architectures increasingly decouple long-term planning from real-time correction, using historical patterns to build reference schedules while online algorithms handle intraday deviations without requiring prediction inputs.
Where do the measurable gains appear when management replaces monitoring alone?
Buildings account for approximately 30% of global energy consumption, with HVAC representing a large share of that load. The question for operations and energy managers is not whether savings are theoretically available; it is where the most reliable gains appear first and how large they are.
Thermal load management provides some of the most clearly documented results. An integrated day-ahead cooling load prediction combined with rule-based TES control achieved a 9.9% energy cost saving rate in a commercial building deployment, measured against actual BAS data. Stochastic dispatch optimization on a combined energy system reduced total dispatch cost by roughly 13% compared to deterministic scheduling on the same asset base, while simultaneously reducing coal plant start-stop cycles from 10 to 7, cutting both equipment wear costs and operational instability.
Time-of-Use (TOU) Tariff: A fixed pricing scheme that applies lower electricity prices during the night and higher prices during the day, according to the balance of supply and demand in the power grid.
Scheduling electric heat pumps to operate during peak renewable generation periods, rather than on fixed timers, achieved a 15% increase in renewable energy share compared to non-optimized baseline operations. In wind-heavy scenarios, generation-matching control for clusters of heat pumps demonstrated up to 95% self-sufficiency by leveraging building thermal inertia as implicit storage. None of these gains require new hardware. They require a management layer that can act on signals the monitoring layer already collects.
The cost structure of underperformance is also concrete. Under Beijing's time-of-use tariff structure, daytime electricity rates run approximately ten times higher than nighttime off-peak rates. A TES system on a fixed schedule that exhausts ice reserves before peak hours forces chiller operation at the most expensive window of the day. Monitoring captures that outcome. Management prevents it.
How are industrial and commercial sites deploying energy management today?
Deployment patterns reflect a consistent architectural principle: energy management systems are being layered onto existing building automation infrastructure rather than replacing it. The monitoring layer, sensors, meters, BAS data streams, remains in place. The management layer adds scheduling logic, forecast integration, and optimization algorithms on top.
In commercial building deployments, integrated prediction and control models are being deployed directly into existing building automation systems, improving cooling efficiency and reducing manual intervention in scheduling decisions. The management layer takes the BAS data that was previously used only for reporting and uses it to drive automated dispatch decisions for TES charge cycles and HVAC setpoints.
Building Thermal Inertia (BTI): The capacity of a building's physical mass to store and slowly release thermal energy, enabling the building to act as a thermal buffer that can absorb or defer heating loads over time.
For multi-regional integrated energy systems combining electricity and thermal networks, game-theoretic optimization frameworks are achieving Nash equilibria between energy suppliers and users, measurably reducing energy usage costs for end users without requiring hardware changes on either side. The optimization runs on top of existing metering and dispatch infrastructure.
Public sector deployments are following a similar pattern, using IoT device data alongside weather forecast signals and grid renewable share data to schedule electric heat pump operation automatically. The management logic selects operating windows based on grid carbon intensity, then registers the schedule on a verifiable ledger for transparency and audit purposes. The monitoring infrastructure is the same; the decision layer is what changed.
How to move from a monitoring-only setup to a full energy management system
The practical transition from monitoring to management does not require replacing existing infrastructure. It requires adding a decision layer that can interpret what the monitoring layer already sees and act on it.
The first step is connecting data sources. SCADA systems, PLCs, BAS outputs, meters, and historians typically already hold the inputs that management logic needs: consumption readings, equipment states, temperature sensors, and production schedules. The transition gap is integration, getting those sources into a unified data model where management algorithms can operate across them simultaneously.
Renewable Energy Share (RE_share): The ratio of renewable energy generation to total aggregate energy generation on the grid, calculated as RE generation divided by aggregate generation, used to identify low-carbon periods for scheduling.
The second step is establishing a baseline. Before optimization can run, the system needs to know what normal looks like for each asset and operating condition. Building metadata, including meter type, building type, and site parameters, provides the conditioning context that makes consumption profiles meaningful. Without that context, anomalies and opportunities look identical in the raw data.
The third step is adding forecast integration. Grid renewable share signals, weather data, and production schedules are the primary inputs that allow a management system to make forward-looking decisions rather than reactive ones. These signals do not require custom data feeds in most cases; they are available through standard APIs and can be ingested alongside existing sensor streams.
Once the decision layer is operating, the monitoring infrastructure that was previously used only for reporting becomes the feedback mechanism that closes the optimization loop: observed outcomes update the management model, and the cycle tightens over time.
How monitoring and management data layers connect inside a digital twin platform
In a digital twin architecture, monitoring and management are not separate systems; they are two functional layers operating on the same unified data model. The monitoring layer handles data ingestion, normalization, and historical storage. The management layer runs optimization logic, forecast integration, and closed-loop control against the live operational state the twin represents.
This separation of concerns matters architecturally. Centralized control approaches that require global knowledge of all asset states create single points of failure and limit scalability as the asset base grows. A digital twin platform distributes that state awareness across a connected data model, so the management layer can operate on accurate, current asset states without requiring a centralized aggregation step that breaks under load.
In hybrid storage architectures, batteries handling short-term supply-demand fluctuations, longer-duration storage providing seasonal energy shifting, the same principle applies across timescales. The monitoring layer captures state at every timescale. The management layer allocates decisions across them: day-ahead unit commitment locked at the planning stage, real-time economic dispatch optimized across renewable scenarios as they materialize.
Integrated Energy System (IES): A multi-energy system combining electricity and thermal energy generation, conversion, and storage facilities, including wind, solar, CHP, and electric boilers, to jointly satisfy electrical and thermal demands across multiple regions.
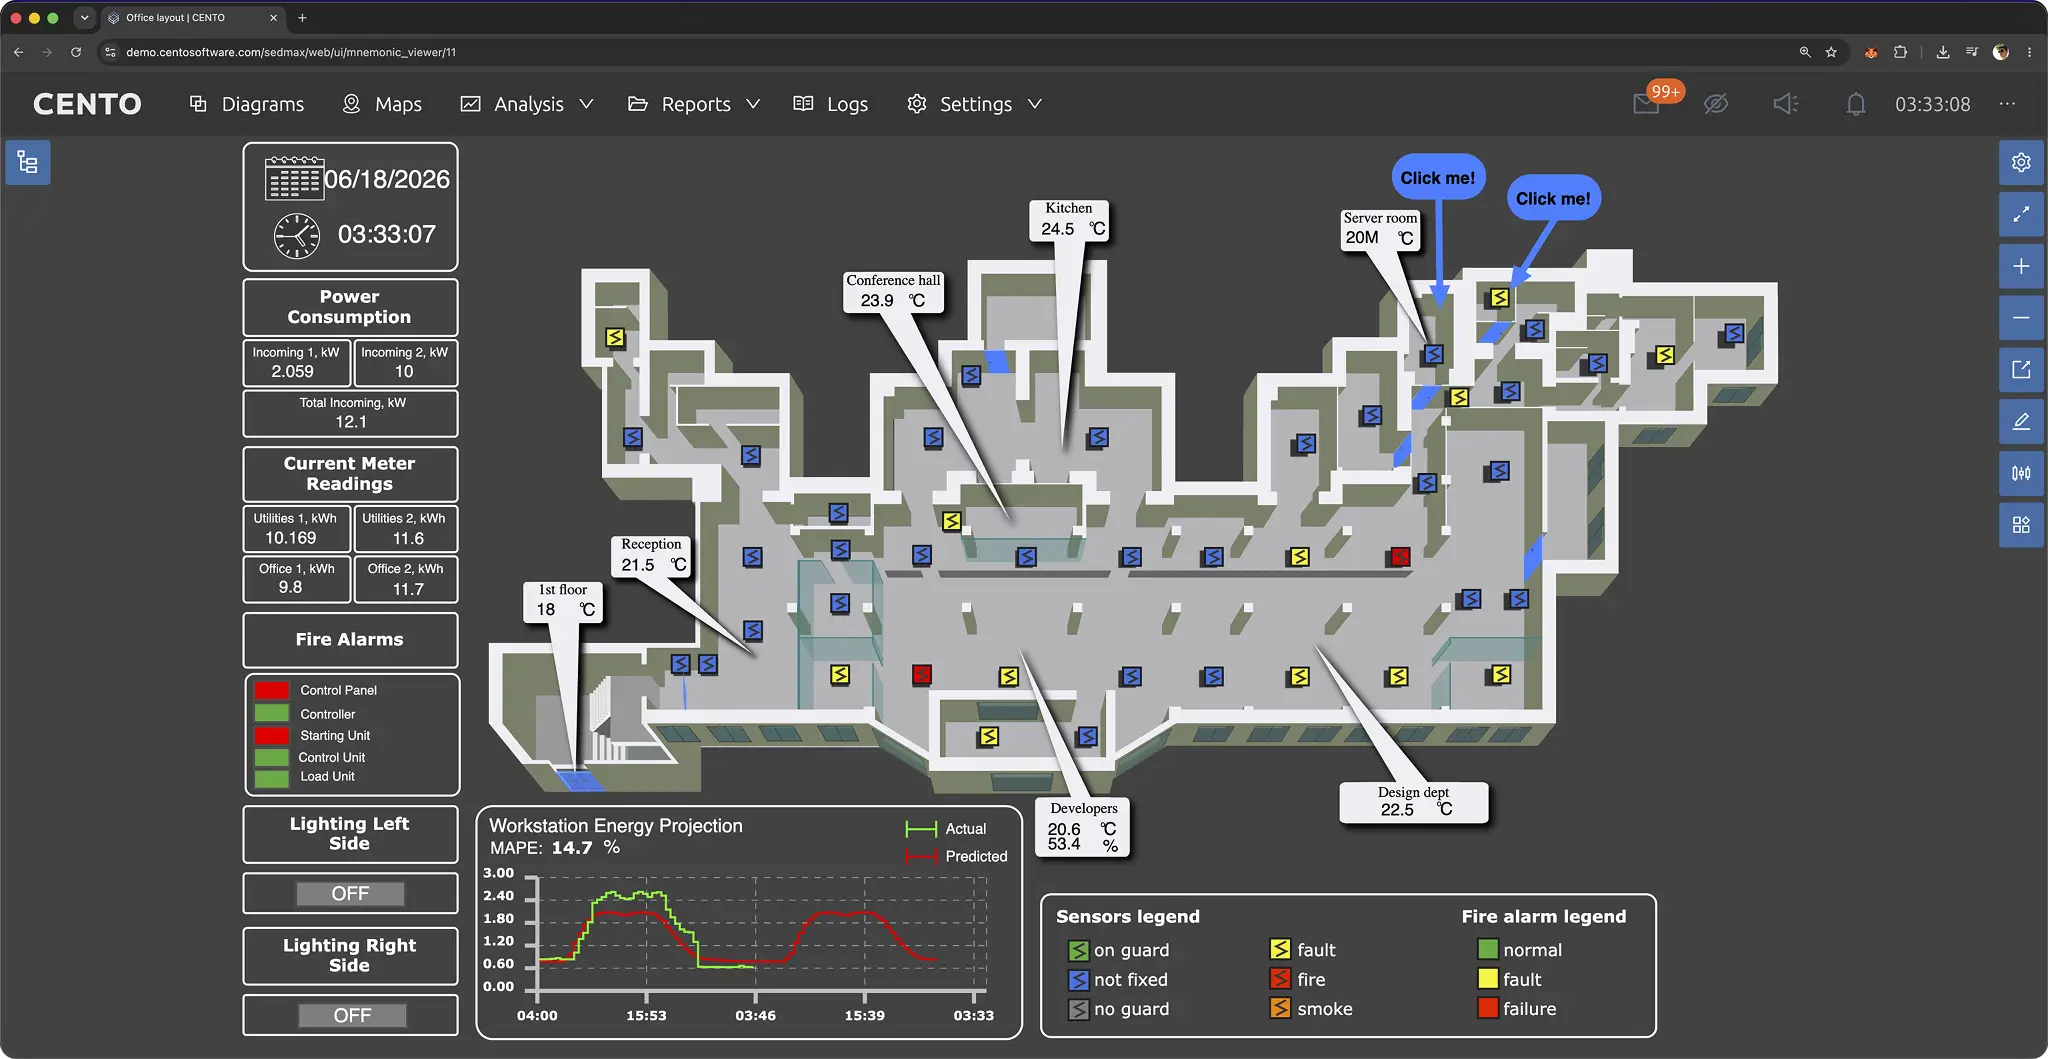
CENTO's platform connects SCADA, PLCs, historians, and BAS outputs into a unified operational data model that both layers share. The monitoring layer surfaces what is happening across all connected assets in real time. The management layer, whether running scheduling logic, optimization algorithms, or anomaly detection, operates on the same live data without requiring separate integration work for each application. The data flows once; both functions use it.
The practical benefit is that sites do not choose between monitoring and management as competing investments. They build on what exists. The monitoring infrastructure that is already generating data becomes more valuable when a management layer can act on it, and the management layer becomes more reliable when it is operating on accurate, contextualized, real-time data rather than batch exports and manual feeds.
Learn how CENTO turns this architecture into real operational results
The architecture described in this article is where CENTO fits into industrial operations. It connects energy meters, SCADA signals, equipment states, production context, and reporting logic inside one software environment. Instead of treating energy data as a separate reporting stream, CENTO brings it into the same operational model used for monitoring, control, analysis, and decision support.
Start with the CENTO product overview to see how the platform combines real-time monitoring, energy metering, power quality analytics, digital twins, event journals, visual diagrams, and industrial data tools in one system. For facilities focused on consumption structure, losses, and ISO 50001 reporting, the Energy Balance module shows how CENTO collects data from meters, sensors, and automation systems, then turns it into real-time energy maps, balance calculations, dashboards, tariff analysis, and automated reports.
For broader utility and resource accounting, the Resource metering, energy balance and reporting capability explains how CENTO supports metering, balances energy usage, and creates compliance-ready reports across the facility. When the task is to connect measurements to asset structure and operational context, the Information model provides the shared data layer that links equipment, sensors, systems, and analytics into one structured industrial model.
Energy management also depends on electrical reliability. The Power Quality Control module supports real-time monitoring of voltage dips, harmonics, load imbalances, and other electrical parameters that affect equipment health, downtime risk, and energy performance. For teams that need fast deployment across existing infrastructure, the Fast Deployment page explains how CENTO supports rapid installation, cross-platform equipment integration, and user adoption without operational disruption.
To see how this works in real deployments, explore CENTO case studies. To evaluate the platform directly, use the CENTO demo server, where you can explore live dashboards, asset models, alerts, trends, and system interactions. For a guided discussion of your facility architecture, contact the CENTO team.
Frequently asked questions
What is the difference between an energy management system and an energy monitoring system?
An energy monitoring system collects, displays, and reports consumption data from meters, sensors, and PLCs. It tells you how much energy was used and when. An energy management system adds a decision layer on top of that data; it uses consumption readings, forecast signals, and cost logic to automatically adjust when and how systems operate, shifting loads away from peak tariff periods and toward lower-cost or higher-renewable windows.
Can an energy monitoring system be upgraded to an energy management system?
In most cases, yes. The transition does not require replacing metering or sensor infrastructure. It requires adding a data integration layer that unifies SCADA, BAS, historian, and PLC outputs into a common model, then layering scheduling and optimization logic on top. The monitoring infrastructure that was previously used for reporting becomes the real-time feedback mechanism that the management layer operates against.
What is demand response and how does an energy management system enable it?
Demand response allows facilities to reduce or shift electrical and thermal loads in response to real-time pricing signals or grid conditions. An energy management system enables this by automatically identifying which loads are flexible, heat pumps, thermal storage, HVAC pre-conditioning, and rescheduling their operation to avoid peak tariff windows or align with periods of high renewable generation. The management layer executes these shifts based on tariff tiers and forecast inputs without requiring manual intervention from operators.
What measurable energy savings does an energy management system typically produce?
Gains vary by asset type and control strategy. Scheduling electric heat pumps around renewable generation peaks has demonstrated a 15% increase in renewable energy share in documented deployments. Prediction-based thermal energy storage control achieved a 9.9% energy cost saving rate in a commercial building in Beijing. Model Predictive Control applied to HVAC systems with accurate system dynamics has reduced building energy demand by up to 30% compared to rule-based controllers.
Which industries benefit most from an energy management system?
Commercial real estate, manufacturing, and public sector building portfolios benefit most clearly, particularly wherever HVAC, heating, and cooling represent a large share of the energy bill. Buildings account for approximately 30% of global energy consumption, with HVAC taking a substantial portion of that. Industrial facilities with dispatchable thermal or electrical loads, time-of-use tariff exposure, or on-site storage also see strong returns from active management rather than passive monitoring.
How long does it take for an energy management system to start producing results?
Most facilities see initial gains within the first weeks of commissioning, once data sources are connected and a consumption baseline is established. Early wins typically come from operational schedule adjustments, rescheduling thermal loads to off-peak windows, aligning HVAC pre-conditioning with occupancy patterns, that require no capital expenditure. Deeper optimization, such as prediction-based TES control and real-time tariff arbitrage, typically matures over one to three months as the management layer accumulates enough operating history to tighten its scheduling logic.
What data sources does an energy management system need to connect?
The core inputs are meter readings, equipment state data from PLCs or SCADA systems, building automation outputs, and production or occupancy schedules. Weather data and grid tariff or renewable share signals are needed for forward-looking scheduling decisions. Most existing industrial and commercial sites already have these data sources in place; the integration step is connecting them into a unified model where the management layer can operate across all of them simultaneously.
How does building thermal inertia relate to energy management?
Building thermal inertia refers to the capacity of a building's physical mass to absorb and slowly release heat. An energy management system can exploit this by treating the building itself as a form of thermal storage: pre-heating or pre-cooling during low-tariff or high-renewable periods, then coasting through expensive windows without running HVAC at full load. Deployments using this approach have demonstrated up to 95% self-sufficiency in renewable energy scenarios.
What is the role of digital twin platforms in energy management?
A digital twin platform provides the unified operational data model that both monitoring and management layers share. It connects SCADA, PLCs, meters, and historians into a single live representation of facility state. This means the management layer, scheduling logic, optimization algorithms, anomaly detection, operates on accurate, current data rather than batch exports or siloed feeds. It also means monitoring outputs and management outcomes are tracked in the same context, making reported savings auditable against real operating conditions.
Does an energy management system require replacing existing SCADA or BAS infrastructure?
No. Energy management systems are designed to layer over existing SCADA and building automation infrastructure through standard protocols, OPC-UA, Modbus, REST, rather than replacing it. The management layer reads from and, where permitted, writes control signals back to existing PLCs and BAS controllers. This approach preserves the investment in monitoring infrastructure while adding the decision-making capability that converts data into operational action.